
Hasn’t Antarctica actually gained ice mass?
When discussing Antarctica, it’s first important to get a sense of scale. Discussions of the Arctic and the Antarctic often confuse the two, but the region around the Earth’s southern pole is much, much larger. Antarctica, the continent, is about 5.4 million square miles in area, which is over 1.5 times the size of the United States. In other words, it’s big.
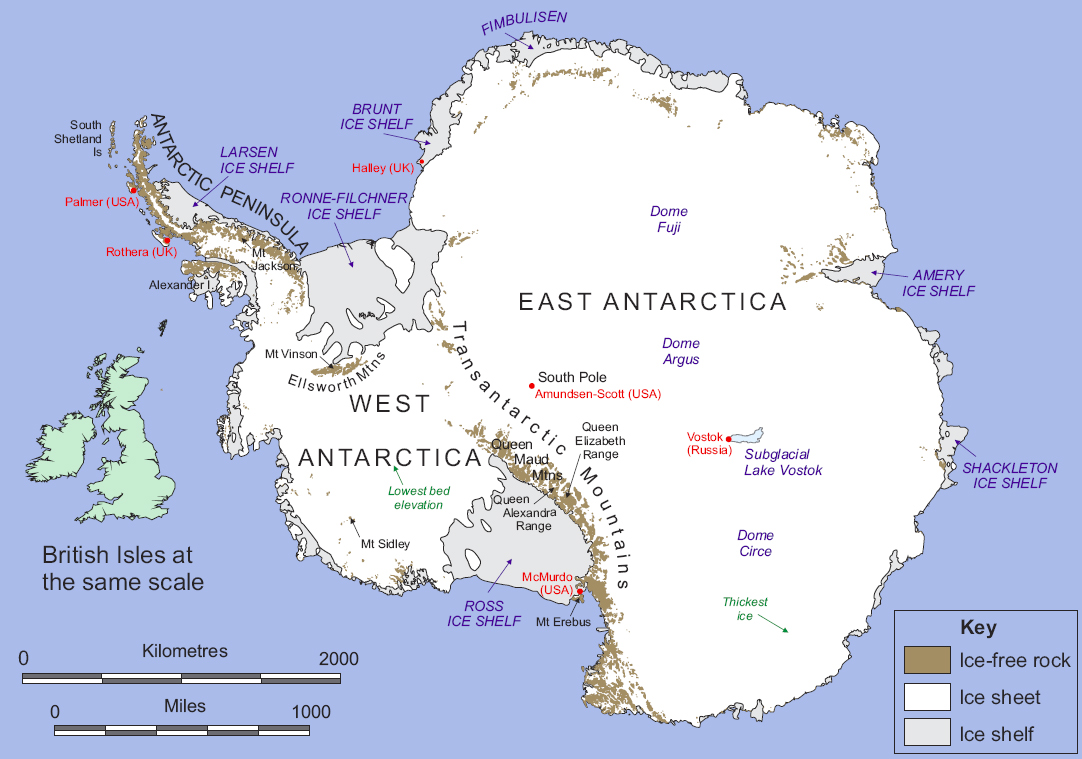
Figure 1: Map of Antarctica. Image credit: British Antarctic Survey (Click for larger version)
The second important consideration is that, by precipitation measurements, Antarctica is the world’s largest desert. It is estimated that the interior of the continent receives less than 2 inches of precipitation a year. By comparison, the Sahara desert receives less than 3 inches per year. But, unlike the warm deserts, what precipitation Antarctica receives doesn’t evaporate. Once it falls it can remain for thousands of years.
The weather in Antarctica is also the most inhospitable on the planet. In July 1983, A weather monitoring station in East Antarctica measured the coldest ground temperature ever recorded at -126.9°F (-88.3° C). The brutal temperatures are accompanied by the strongest sustained winds on the planet where coastal recording stations can measure wind speeds upwards of 200 miles per hour.
Due to these extreme conditions, most of the weather recording stations on the continent are necessarily placed close to its edges. As a result, the amount of direct measurements available, especially concerning the interior, is sparse.
To gain a perspective on the amount of ice involved, Antarctica contains enough ice to raise sea levels around the world 200 feet if it were to ever melt.
These extreme conditions and difficulty in obtaining direct measurements are combined with the existence of a hole in the ozone layer that is centered above the region. This combination of factors makes analysis and understanding of the Antarctic climate exceedingly difficult.
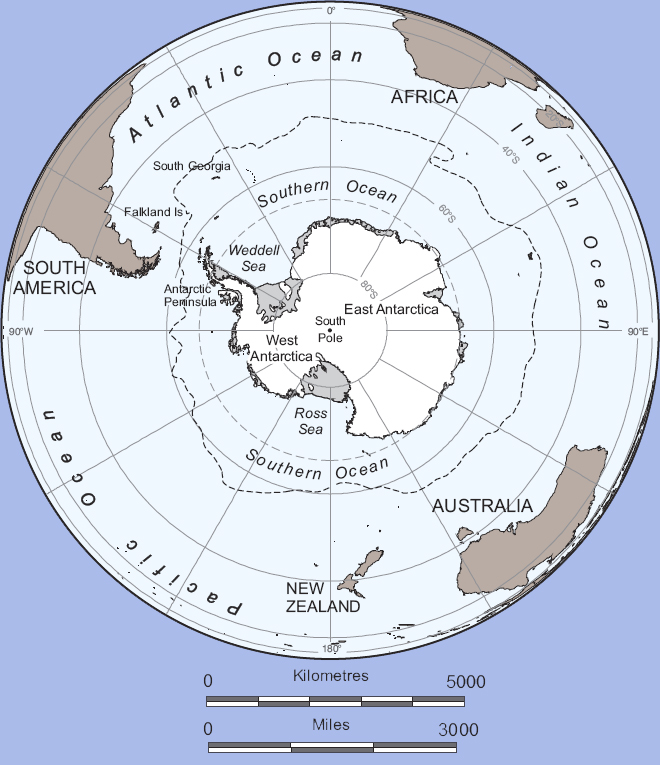
Figure 2: Contextual Map of Antarctica. Image credit: British Antarctic Survey (Click for larger version)
However, with a warming world, you would expect to see the greatest impact on Antarctica at its edges. During the course of the Antarctic year, overhead views of the ice reveal the presence of surface level ponds of melt water. This water then seeps into cracks in the ice. Previously it was thought that this water would then simply refreeze. To the contrary, the water can seep all the way through the ice to its base. The cracks through which this water runs are called moulins. As this water drains, it lessens the stability of the ice. Couple this with a warming of the water on which an ice shelf floats, and the ice is being impacted from both above and below, and these impacts can eventually lead to its breakup.

Figure 3: Moulin located on the Greenland ice sheet. Image created: NASA
In March 2002, Antarctica generated headlines when the Larsen B ice shelf broke up and separated from the continent. The area of ice lost was larger than the state of Rhode Island. Based on sediment analysis, it was believed the shelf was at least 400 years old and likely dated back to the last major glaciation period 12,000 years ago. This large mass of ice broke up in a matter of 35 days.
While ice shelves float on the surrounding ocean water, they block the path to ground based glacial ice behind them. So, when an ice shelf disintegrates, it exposes that land based ice. For ground based ice, once the melt water mentioned earlier reaches the base through moulins, it serves as a lubricant between the ice and the ground beneath, enabling the ice to slide toward the surrounding ocean. With the ice shelf no longer blocking its path, this slide can speed up. And that’s exactly what scientists observed happening after the collapse of Larsen B as the slide of the glaciers surrounding the area accelerated.
And as you can see from the NASA image in Figure 4, ice loss is happening rapidly along all of the ice shelves around the perimeter of the Antarctic continent.

Figure 4: Antarctic ice loss between 1996 and 2006, overlaid on a Moderate Resolution Imaging Spectroradiometer (MODIS) mosaic image of Antarctica. The colors indicate the speed of the ice loss. Purple/red is fast. Green is slow. Image credit: NASA
With warming temperatures and increased ice loss around the perimeter of the continent, more water vapor enters the atmosphere. This can lead to an increase in precipitation in the interior of the continent. A study in 2005 found that the ice sheet in East Antarctica was indeed gaining ice and attributed those gains to an increase in the precipitation over the region.
As mentioned earlier, with Antarctica being the largest desert in the world, an increase in precipitation would have a noticeable effect.
Based on the difficulties inherent in Antarctic conditions, whether or not Antarctica is gaining or losing ice on the whole is difficult to ascertain definitively. However, whether or not the continent is experiencing the impacts of a warming world is not.
A recent study found that Antarctica is not warming as fast as predicted by climate models. The results of the study reinforce the difficulties encountered in understanding and therefore predicting the behavior of the Antarctic climate. And while some may take comfort that the continent is not warming as fast as expected, those results can actually be quite worrisome. That the observed rapid melting around the perimeter of the continent is happening with a lower-than-expected temperature variance, it leaves open to question what would happen should the temperature rise accelerate and not in a reassuring way.
Additional Reading:
Articles
- Antarctica in Context – British Antarctic Survey
- Antarctic ‘not as warm as feared’ – Telegraph (UK) (May 8, 2008)
- Huge Iceberg Breaks Away, Antarctic Ice Shelf ‘Hangs By A Thread’ – Science Daily (March 25, 2008)
- Antarctica is Cold? Yeah, We Knew That – RealClimate (February 12, 2008)
- Antarctic Ice Loss Speeds Up, Nearly Matches Greenland Loss – NASA (January 24, 2008)
- NASA-Conceived Map of Antarctica Lays Ground for New Discoveries – NASA (November 27, 2007)
- Analysis Finds Large Antarctic Area Has Melted – N.Y. Times (May 16, 2007)
- NASA Mission Detects Significant Antarctic Ice Mass Loss – NASA (March 2, 2006)
- Antarctic cooling, global warming? – RealClimate (December 3, 2004)
Resources
- British Antarctic Survey
- National Snow and Ice Data Center
- Antarctic Master Directory – NASA
- Antarctic Temperature Analyses (1960-2002) – University of Illinois
- Discover Antarctica – National Geographic


Discussion
No comments yet.