Global Warming 101
The Greenhouse Effect
The Human Impact
A Global Balancing Act
Current Conditions
Inertia, Feedbacks, and Tipping Points
In this section of our discussion on global warming and climate change, we’ll be covering some of the current conditions of both forcings and effects within Earth’s climate system.
Up to this point, we noted that carbon dioxide is a primary driver of long-term changes in the Earth’s vital greenhouse effect and that human activities have driven atmospheric CO2 levels to their highest point in 650,000 years and at a rate likely unprecedented in Earth’s history outside of catastrophic events.

Figure 4-1: Temperature and solar irradiance diverged about 30 years ago. Image credit: Max Planck Institute
CLICK TO ENLARGE
But how does this human forcing align with other, natural forcings on the climate system, and how is the climate system reacting?
Let’s first consider the Sun. Variations in solar irradiance during the roughly 11-year sunspot cycles generally fall within a very small range. However, there can be longer trends of increased activity or dormancy. Extended periods of solar activity or dormancy are often associated with the Medieval Warm Period which saw the Vikings settle parts of Greenland and the Little Ice Age which saw Britons skating on the river Thames.
")
Figure 4-2: ENSO has been steady over the past 30 years. Data source: NOAA. CLICK TO ENLARGE
So, the solar influence over the last 30 years has been one of stasis in the climate system if not a promotion of cooling.
Global temperatures can also be influenced by oceanic conditions. By now, we’ve all heard of the climate condition known as El Nino, and its cousin La Nina, which refer to oceanic and wind patterns over the equatorial Pacific ocean. Shifts in these conditions generally last several months and can have a significant influence on temperatures. A particularly strong El Nino condition in 1998 is credited with helping to push global temperatures to some of their highest levels on record.
However, these conditions, while influential, are short lived. Looking in Figure 4-2 at the 30-year trend of the El Nino / Southern Oscillation (ENSO) index, which tracks these conditions, we see that over the last 30 years, ENSO has promoted a stasis condition in the overall climate.
")
Figure 4-3: The PDO has trended down in the last 30 years. Data source: JISAO. CLICK TO ENLARGE
“The Pacific Decadal Oscillation (PDO) has experienced phase shifts that coincided with the major periods of warming and cooling in the 20th Century.”
– Dr. Roy Spencer, University of Alabama, Huntsville, October 2008
Similar to El Nino and La Nina, the Pacific Decadal Oscillation, or PDO, refers to ocean and wind patterns in the Pacific Ocean. However, where ENSO conditions are focused near the equator, PDO conditions focus on the northern Pacific. Where ENSO conditions generally last for months, shifts in the PDO between its warming and cooling phases can extend for a decade or longer. And, while ENSO shifts are reasonably predictable, PDO shifts are more difficult to pin down. Perceived long-term changes from one phase to the other can be unexpectedly cut short.
However, during its extended phases, it can have a notable influence on temperatures, with a warmer PDO generally resulting in warmer temperatures and a colder PDO resulting in colder temperatures.
Examining its trend over the last 30 years in Figure 4-3, the PDO index has promoted cooling conditions.

Figure 4-4: Atmospheric CO2 concentration has continued to increase in the last 50 years. Data source: NOAA. CLICK TO ENLARGE
So what role is played by volcanoes? During a volcanic eruption, massive amounts of gases and ash are ejected into the atmosphere. Aerosols from these eruptions can reflect sunlight back into space, and, if the eruption is large enough, winds in the stratosphere can carry these aerosols around the planet, impacting global temperatures for a brief period of time. This was the case in 1991 when aerosols from the eruption of Mt. Pinatubo in the Philippines decreased global temperatures 1 to 2 degrees for a period of about two years.
Learn More
Volcanic Gases and Climate Change
The last 30 years has seen no decline in volcanic activity and has included the eruptions of Pinatubo as well as El Chichon in Mexico in 1982. As a result, any volcanic influence over the last 30 years would be one of cooling.
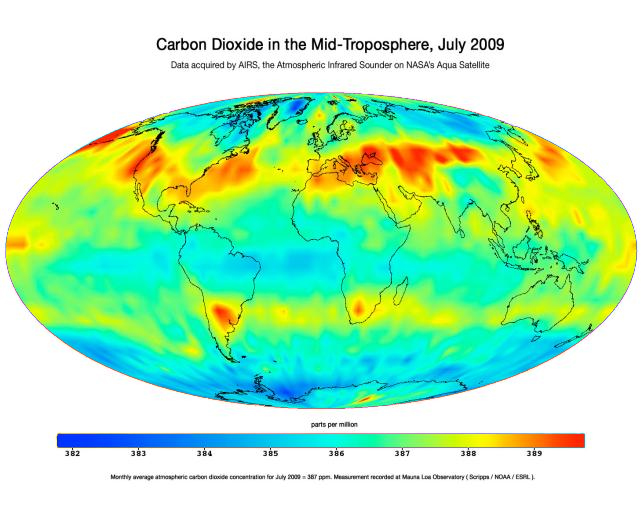
Now we come to increases in atmospheric CO2 concentrations driven by human activities. As shown in Figure 4-4, atmospheric levels of CO2 have increased 15% over just the last 30 years, and satellite data confirms that these increased levels of CO2 vary by as little as 8 parts per million across the globe, reflecting the mixing of the gas throughout the atmosphere, making its impact truly global.
As a greenhouse gas, these increased levels have a warming influence on the climate.
")
Figure 4-5: Global temperatures have continued trending upward over the last 30 years. Data sources: NASA GISS, UAH, RSS, Hadley Centre. CLICK TO ENLARGE
But how has the climate responded, particularly over the last 30 years?
The best place to start would be to look at global surface temperatures. Temperature records are maintained by four sources, NASA’s Goddard Institute for Space Studies (NASA GISS), the UK’s Hadley Centre, the University of Alabama at Huntsville (UAH), and Remote Sensing Systems (RSS) in California. The first two focus on measurements from land and ocean-based stations whereas the latter two focus on measurements taken from satellites.

Figure 4-6: As atmospheric CO2 goes up, oceanic pH goes down. Increasing absorption of CO2 by the world's oceans has caused surface waters to become 30% more acidic since the start of the Industrial Revolution. Image credit: C-MORE. CLICK TO ENLARGE
As shown in Figure 4-5, over the last 30 years, all four have shown a notable rise in global temperatures. Not unexpectedly, different areas of the global warm faster than others, with the land-containing northern hemisphere rising faster than the largely oceanic southern hemisphere.
As global temperatures have risen, so have global sea levels. Rises in sea level can come from multiple factors including thermal expansion of the water as it warms and from melting ice sheets. Considering ocean and wind currents and topography, sea levels do not rise uniformly everywhere, with some areas rising faster than others.
As CO2 emissions to the atmosphere have accelerated, so has absorption of the gas into the world’s oceans. This increased absorption is happening much faster than ocean currents can cycle the gas to the deeper ocean. While this increased absorption has provided a massive buffer to human emissions, it results in oceanic surface waters becoming more acidic. The acidity of global surface waters has increased by 30% since the beginning of the Industrial Revolution. This rapid change in oceanic pH can have a profound impact on the survival of ocean life and entire oceanic food chains along with the human societies that rely on them.
")
Figure 4-7: Analysis of recent satellite measurements indicate Antarctica has been losing more than a hundred cubic kilometers (24 cubic miles) of ice each year since 2002. Image credit: NASA. CLICK TO ENLARGE
“The current rate of change is much more rapid than during any event over the last 65 million years. These changes in ocean chemistry are irreversible for many thousands of years, and the biological consequences could last much longer.”
– Interacademy Panel, June 2009
Antarctica represents the most inhospitable environment on the planet with freezing temperatures and large wind gusts. Covering an area one and a half times the size of the United States, the continent on the Earth’s southern pole is actually the world’s largest desert receiving less precipitation each year than the Sahara Desert in Africa. This snow and ice-covered continent contains both ice shelves, which float on ocean water, and ice sheets, which rest on land.
Learn More
Ice Loss in Antarctica
Examining Antarctica via satellite, it’s apparent that the ice shelves that can be found along the perimeter of the continent and particularly in West Antarctica are experiencing increasing ice loss. The Larsen B ice shelf which had been in place for 400 years and likely since the last major glaciation 12,000 years ago broke up in 2002 in a period of only 35 days, removing an area the size of Rhode Island. Ice loss at the perimeter is offset by ice gain in the interior as warmer conditions result in increased precipitation. However, a recent analysis of satellite data has concluded that, on the whole, Antarctica has been losing more than a hundred cubic kilometers (24 cubic miles) of ice each year since 2002 as shown in Figure 4-7.
Since ice shelves float on water, their melting does not contribute to sea level rise. However, ice shelves also block the paths of the land-based ice sheets behind them. As ice on the shelves is lost, the slide of the land-based ice sheets toward the oceans can accelerate.

Figure 4-8: Arctic sea ice extent and overall volume have declined in the last 30 years. Image credit: University of Washington. CLICK TO ENLARGE
Learn More
Arctic Sea Ice 101
The Arctic is also home to large methane deposits in permafrost. As this permafrost melts, it releases this powerful greenhouse gas back into the atmosphere, which can also accelerate warming.
Monitoring of the world’s glaciers has been ongoing since 1894, and the World Glacier Monitoring Service (WGMS) currently compiles data from glaciers on every continent in the world.

Figure 4-9: The world's glaciers have been losing mass in the last 30 years. Image credit: WGMS. CLICK TO ENLARGE
Learn More
The Extreme Ice Survey
Looking at current conditions, we’ve noted that over the last 30 years, several natural forcings have promoted stasis or cooling within the global climate. Over this same period, atmospheric CO2 and global temperatures have continued to rise despite natural opposition. This continued warming trend is reflected by multiple indicators around the world.
And lastly, while some natural cycles, like solar irradiance and the oceanic PDO, are currently opposing the warming trend, these cycles will cycle back and reinforce anthropogenic warming, driving temperatures even higher.
But why is action related to global warming so urgent?
That will be the subject of our final section.
Continue to “Part 5 – Inertia, Feedbacks, and Tipping Points”

Comments are closed.